FAQ for RT-qPCR
Promega Corporation
What is real-time PCR?
Performing PCR in real time means that product formation is measured at each cycle as it is occurring by measuring a change in a fluorescent reporter signal. With traditional, end-point PCR the signal is measured only once after the cycling program has ended. Real-time PCR should not be confused with RT-PCR, which is reverse transcription PCR, where the starting template is RNA that is reverse transcribed into a cDNA target prior to PCR.
What kind of reporter can I use in my real-time PCR assay?
There are two general types of fluorescent reporters that are used in real-time PCR assays:
Double-stranded DNA-binding Dyes
Double-stranded DNA-binding dyes are dyes that bind to the minor groove of double-stranded DNA (dsDNA). The free dye has a very low fluorescence, whereas the bound dye has a high fluorescence. The more double-stranded PCR product that is produced, the greater the fluorescence signal will be. BRYT Green® Dye is an example of a dsDNA-binding dye. These dyes allow you to use standard PCR primers, so there is no need to order special labeled primers. The disadvantage is that the signal is not sequence-specific, so you will need to verify that the reaction is producing the desired product.
Labeled Primer or Probe
The second type of reporter method uses a labeled primer or probe to detect the amplification product. There are many different ways to modify reporter signal generation. Real-time PCR using labeled oligonucleotide primers or probes employs two different fluorescent reporters and relies on energy transfer from one reporter (the energy donor) to a second reporter (the energy acceptor) when the reporters are in close proximity. The second reporter can be either a quencher or a fluor. If the second reporter is a quencher, the energy from the first reporter is absorbed but re-emitted as heat rather than light, leading to a decrease in fluorescent signal. Alternatively, if the second reporter is a fluor, the energy can be absorbed and re-emitted at another wavelength through fluorescent resonance energy transfer (FRET, reviewed in Didenko, 2001[2]), and the progress of the reaction can be monitored by the decrease in fluorescence of the energy donor or the increase in fluorescence of the energy acceptor.
Some qPCR strategies employ complementary nucleic acid probes to quantify the DNA target. These probes also can be used to detect single nucleotide polymorphisms (1–2). There are many different types of real-time PCR probes, including hydrolysis, hairpin and simple hybridization probes. Probes contain a complementary sequence that allows the probe to anneal to the accumulating PCR product, but can differ in the number and location of the fluorescent reporters. The use of simple hybridization probes involves two labeled probes or, alternatively, one labeled probe and a labeled PCR primer. In the first approach, the energy emitted by the fluor on one probe is absorbed by a fluor on the second probe, which hybridizes nearby. In a second approach, the emitted energy is absorbed by a second fluor that is incorporated into the PCR product as part of the primer. Both of these approaches result in increased fluorescence of the energy acceptor and decreased fluorescence of the energy donor. The TaqMan® Assay is an example of a method that uses a labeled probe. The big advantage that label-based methods offer is the ability to multiplex two or more targets in a single reaction. This would allow you to measure an experimental gene and a control gene for normalization in the same reaction.
What do I do with the amplification curve?
The primary output from your real-time PCR instrument is an amplification curve. The curve shows the fluorescent signal as RFUs versus the cycle number and thus shows the accumulation of amplified product. The amplification curve can be broken down into three parts. The baseline is the point early in the amplification process where very little product has been produced and the signal is still below the background noise of the assay. The exponential phase occurs around the time that the reaction reaches the amplification threshold; and indicates that the product is doubling with every cycle. This phase can be seen more clearly if the results are graphed on a semi-log plot.
How do I use my results to quantitate my starting material?
Quantifying the amount of starting material is done using the quantification cycle (Cq; also known as Ct). The Cq is the cycle number where the amplification curve crosses the amplification threshold. Once you have the Cq value, there are two approaches for converting that value to template quantity. In absolute quantification, the Cq value can be used to determine the amount of an unknown sample using a standard curve derived from reactions which contain known amounts of the target RNA (cDNA). The standard curve is generated by plotting the Cq versus concentration (log concentration) for the standard curve samples. The concentration of unknown samples then can be determined using an equation derived from the linear regression analysis of the standard curve.
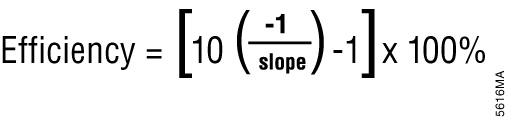
Most real-time PCR instrument software can also perform relative quantification using the Cq values. Relative quantification is based on the premise that each template is replicated with each cycle; therefore, n cycles would produce 2n product. This relationship also works in reverse; for example, two samples with a Cq difference of 1 would have a twofold difference in starting template amount. This is the basis for the simplest algorithm for relative quantitation (3); however, this is only accurate if amplification efficiency is 100 percent. Amplification efficiency can be calculated from a standard curve (done during assay validation) using the equation shown in Figure 1 (4). If amplification efficiency is less than 100%, then relative quantification calculations must be adjusted to correct for the decreased efficiency (5).
What is the first step?
RT-qPCR is the same as qPCR but using a starting template of RNA that is reverse transcribed (RT) to cDNA prior to amplification. A successful RT-qPCR assay is dependent on the success of the RT reaction, and successful reverse transcription depends on RNA integrity and purity. There are several methods for evaluating your RNA before proceeding to the RT step. RNA integrity can be assessed qualitatively by gel electrophoresis or quantitatively using systems such as the Agilent Bioanalyzer, which uses microfluidics to size‐separate and quantitate RNA. RNA quantity and purity can be assessed by absorbance. The quantity is determined by absorbance at A260, and quality is measured using a ratio of absorbance at A260/A280. High‐quality RNA should have a minimum A260/280 ratio of about 2. Spiking experiments, in which RNA of unknown quality is added to an RT-qPCR that has amplified well in the past, can be used to detect inhibitors. It is a good idea to include a no-RT qPCR control reaction to detect gDNA contamination. Finally, quantifying the RNA will help normalize the amount of RNA you are including in each reaction.
Anytime you are working with RNA, RNA degradation is a concern. We recommend that you have a dedicated, ribonuclease-free (RNase-free), area for all RNA work. Procedures for creating and maintaining a RNase-free environment to minimize RNA degradation should be followed faithfully. Using an RNase inhibitor (e.g., Recombinant RNasin® Ribonuclease Inhibitor, Cat. #N2111) is strongly recommended.
What is the difference between one-step and two-step RT-qPCR?
The fundamental difference between these two approaches is whether the RT step is performed separately from the PCR or in the same tube. For one-step RT-PCR, the RT and PCR steps are performed sequentially in the same tube using the entire amount of the cDNA synthesis products as the template for PCR. For two-step RT-PCR, the RT and PCR steps are also performed sequentially, but only a portion of the cDNA products is used as a template for PCR, which is performed in a separate tube. For this reason, one-step RT-PCR may be the more sensitive approach. However, two-step RT-PCR allows multiple PCRs from a single RT reaction, which works well for quantifying multiple targets or for doing replicate assays.
One-step RT-PCR commonly uses gene-specific primers for both the RT and PCR steps, with one of the PCR primers also acting as the RT primer. Two-step RT-qPCR can use oligo(dT) primers or random primers for the RT step. For RT-qPCR, a sequence-specific primer also can be used.
Real-Time PCR Terms
ΔR: baseline-corrected fluorescence (R) — R minus average R over baseline region.
Passive reference: free dye (unassociated with amplification product) used for normalization to control for experimental and optical variation).
Rn: normalized fluorescence — R divided by passive reference.
ΔRn: baseline-corrected, normalized fluorescence.
Experimental Target: the target gene, transcript, channel or dye of interest.
Control Target: normalized, endogenous control, reference gene, transcript, channel, dye or housekeeping gene.
Experimental Sample: unknown or treated sample.
Control Sample: calibrator, reference sample.
RT-qPCR Resources
General
Gene Quantification: www.gene-quantification.info/
A–Z of quantitative PCR (Editor: S.A. Bustin ), International University Line (IUL), La Jolla, CA, USA.
Design, Validation, Controls, Normalization
Sean Taylor, et al. “A MIQE Case Study — Effect of RNA Sample Quality and Reference Gene Stability on Gene Expression Data” 2011, Bio-Rad tech note 6245.
Garbarino-Pico, E. et al. (2007) Immediate early response of the circadian polyA ribonuclease nocturnin to two extracellular stimuli. RNA 13, 745–755. PMID:17400819
Pre Designed qPCR Primers
Primer Design Software
References
- Lee, L.G., Connell, C.R. and Bloch, W. (1993) Allelic discrimination by nick-translation PCR with fluorogenic probes. Nucleic Acids Res. 21, 3761–6.
- Bernard, P.S., Lay, M.J. and Wittwer, C.T. (1998) Integrated amplification and detection of the C677T point mutation in the methylenetetrahydrofolate reductase gene by fluorescence resonance energy transfer and probe melting curves. Anal. Biochem. 255, 101–7.
- Livak, K.J. and Scmittgen, T.D. (2001) Analysis of relative gene expression data using real-time quantitative PCR and the 2(-Delta Delta C(T)) Method. Methods 25, 402–8.
- Bustin, S.A. (2004) A–Z of quantitative PCR. International University Line, La Jolla.
- Pfaffl, M.W. (2001) A new mathematical model for relative quantification in real-time RT-PCR. Nucleic Acids Res. 29, e45.
GoTaq® qPCR and RT-qPCR Systems
Related Resources
Minimum Info for Publication of Quantitative RT-PCR Experiments
MIQE prodives authors, reviewers and editors specifications for the minimum information that must be reported for a qPCR experiment.
Maximize Your Reverse Transcription-qPCR Assays
This webinar covers the basics of RT-qPCR, including an overview of the technique as well as data analysis and interpretation.
RNase Contamination Happens; Safeguard Your Samples
We evaluated nine buffers and water samples to assess the level of RNase contamination present in a laboratory area designated as "RNase-free".